The classification of igneous rocks is largely based on two diagrams: QAPF diagram for plutonic rocks (formed in the crust) and TAS diagram for volcanic rocks. I made the schemes using the coordinates provided in the following book: Le Maitre, R. W. (2005). Igneous Rocks: A Classification and Glossary of Terms: Recommendations of the International Union of Geological Sciences Subcommission on the Systematics of Igneous Rocks (2nd edition). Cambridge University Press.
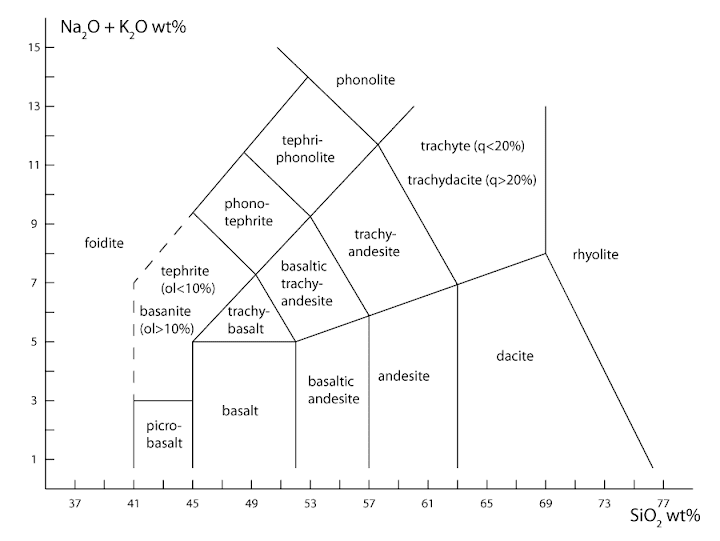
TAS diagram for volcanic rocks.
These coordinates are shown on the second diagram which you can use to construct your own diagram if you wish. The use of TAS diagram is very simple and straightforward. You only need to know the major element chemical composition of the rock sample being studied. There are SiO2 on the x-axis and the sum of K2O and Na2O on the y-axis. TAS stands for Total Alkali Silica.
Here are the coordinates of the intersections.
There is no doubt that the use of such a scheme is no rocket science but what is the biggest problem is that we need to know the chemical composition of the sample. There is really no way to do it reliably if you do not have an access to very expensive equipment which is used to analyse the chemistry of rocks.
Probably at least partly because of that, TAS diagram is actually not the first choice you should consider if you need to identify volcanic rocks. There is an analogue of QAPF diagram designed specifically for volcanic rocks which we should use if we can determine the mineralogical composition of the rock. In many cases we can not do it because volcanic rocks tend to be too fine-grained even for microscopic study and they often contain volcanic glass which may have very versatile composition. And here comes the second problem which for me is even more serious than the first one. QAPF diagram and TAS diagram are based on different criteria. There is absolutely no guarantee that a rock sample which was correctly identified as trachyte using QAPF diagram is still trachyte if we make a chemical analysis of it and plot the results on the TAS diagram.
But this is the reality we have to live with right now. The classification principles are not perfect but they are probably good enough because they have been in use for several decades already and nowadays they seem to have gained international recognition. There are some additional things which have to be accounted for if you’re going to use the TAS diagram. I recommend to consult the book mentioned above.
I have also written a post about how QAPF and TAS diagrams are related and how to make them match each other: A little fun with diagrams.
a brief description would be of much help full for using the TAS diagram and how to analyze the result.
What exactly do you mean? The diagram seems to be pretty much self-explanatory. There are some aspects that would be useful to know. Maybe I will write about it more thoroughly in the future but the book recommended is invaluable for those who are more deeply interested about the topic.
if we could extrapolate the inclined lines , then we could get the point where the inclined line and axis will meet.. so by knowing angle from those points ..it will be more easy to draw in exams..
thank you very much for coordinate method
Very helpful TOPIC !! 🙂
May you share some about geochemical analyses made for the rocks
please
Hey,
thanks for the good overview. With the coordinates I can construct my own TAS-diagram. But with which program did you design yours? And what would be even more helpful: Is there a program in which I can just enter chemical data to get them plotted in a TAS diagram? Maybe a pattern for excel or so?
Thank you and keep up the good work 🙂
I made my diagrams with Adobe Illustrator. I believe you can find geology soft for TAS diagrams but I am not aware of Excel based programs.